
First Win / Free research
How accurate are NFL betting odds?
A five-season test of moneylines, spreads and totals around ten minutes before kickoff.
The quick take
The probabilities held up better than the prices.
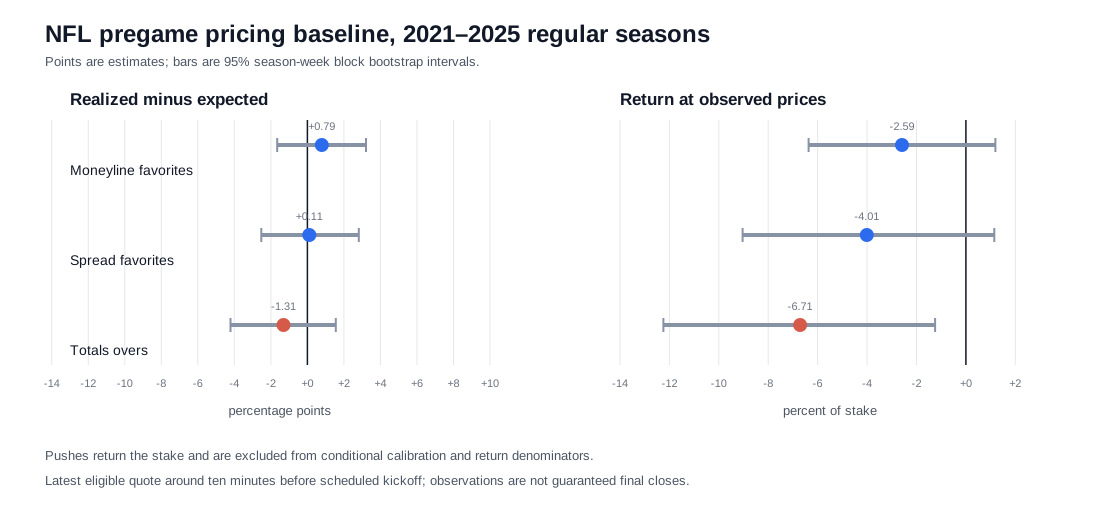
NFL pregame prices looked broadly compatible with what happened on the field, but this study was not precise enough to certify one-percentage-point accuracy. Every calibration interval included zero, while all three selected bets lost at the prices offered.
Follow the evidence
Calibration and return
Points are estimates. Bars are 95% season-week block bootstrap intervals.
The numbers
| Market and selection | Games | Expected | Actual | Gap | 95% week-block interval | Return | Return interval | Pushes |
|---|---|---|---|---|---|---|---|---|
| Moneyline favorites | 1,359 | 66.15% | 66.94% | +0.79pp | [-1.65, 3.21]pp | -2.59% | [-6.37, 1.20]% | 4 |
| Spread favorites | 1,352 | 50.08% | 50.19% | +0.11pp | [-2.53, 2.81]pp | -4.01% | [-9.04, 1.15]% | 29 |
| Totals overs | 1,359 | 50.05% | 48.74% | -1.31pp | [-4.21, 1.55]pp | -6.71% | [-12.24, -1.25]% | 13 |
Expected win rates remove each book's margin first. Returns use the observed quoted prices. Pushes return the stake and are excluded from conditional win-rate and decided-stake return denominators.
What it means
A market can estimate probabilities reasonably well while still offering losing prices. Calibration asks whether 60% propositions win about 60% of the time. Return asks what happened after paying the sportsbook's margin.
The totals result needs restraint. Overs lost clearly in this historical sample, but that does not turn unders into a demonstrated strategy. Both sides paid margin, and the complementary analysis used the same games.
The catch
This is a retrospective benchmark. The 2021-2025 outcomes were visible during data validation, so none is an untouched confirmation sample. These are the latest eligible quotes around ten minutes before scheduled kickoff, not guaranteed final closing prices or guaranteed fills.
Five complete seasons still left calibration intervals roughly five to six percentage points wide. A future frozen season is needed to test repeatability.
Methodology, version and provenance
Ten historically available books. Per-book proportional de-vigging followed by an equal-book average. Spreads and totals use the modal quoted line. Research QA, deliverable QA and deterministic replay passed.
First Win Pro
Build the benchmark your model actually has to beat.
The companion note turns this result into a research standard: matching market, line, price and pregame window, plus the uncertainty hurdle an apparent edge should clear.
Read the Pro companionExplore the underlying markets
Get new sports-market research when we publish
New research, straight to your inbox. No picks, no promotions. Our public studies stay free to read without an account.